


Average Household Balance
Deposit Accounts by Region
$28,230
$29,309
$33,581
$32,694
$30,843
northeast
southeast
south
upper midwest
west
key

about the data
view by�bank size
Deposit Accounts: $33,021 | checking accounts: $12,379
national average
about the data
Average Household Balance: Deposit Accounts includes all Consumer Checking, Savings, Money Market, CDs, and IRA accounts�
Average Household Balance: Checking Accounts includes only Consumer Checking accounts
Comparisons are 2022 to 2023
Data: BAI Consumer Deposits Benchmarking
•
•
•
•
get started

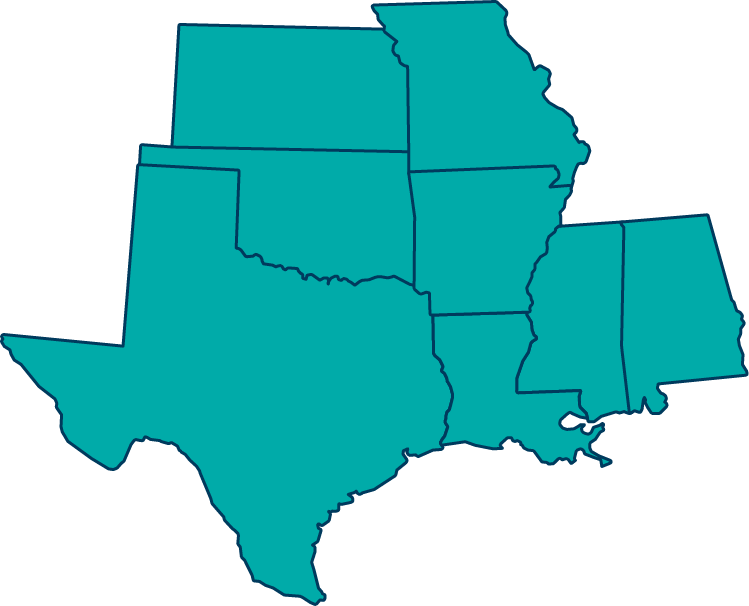
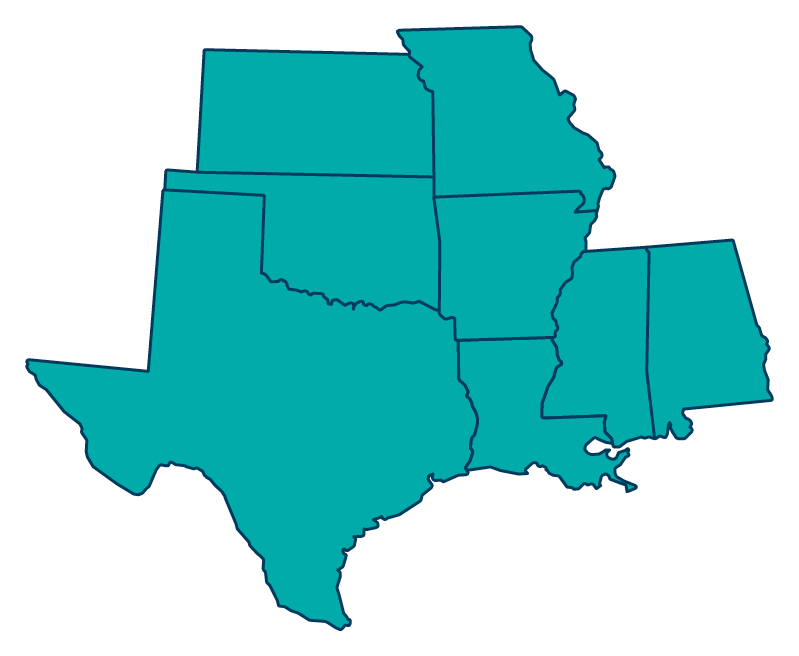
Interactive Map: Household Deposit Balance Accounts
Explore key data about average household deposit balances, broken down by region and categorized by bank size. Curious how certain areas or bank sizes stack up against the national average? We’ve got you covered. With a few clicks, you can uncover detailed insights about average checking balances and track year-on-year growth trends.
Click on a map region or a building to zoom into the specifics, revealing quick summaries that make comparisons seamless. It’s an easy, interactive way to view deposit trends at a glance.
$28,230
$29,309
$33,581
$32,694
$30,843
Deposit Accounts: $33,021 | checking accounts: $12,379
national average
west
upper midwest
south
southeast
northeast
key
view by�bank size
Deposit Accounts by Region
Average Household Balance
Average Household Balance
Deposit Accounts by Region
$28,230
$29,309
$33,581
$32,694
$30,843
northeast
southeast
south
upper midwest
west
key
about the data
view by�bank size
Deposit Accounts: $33,021 | checking accounts: $12,379
national average
about the data
Average Household Balance: Deposit Accounts includes all Consumer Checking, Savings, Money Market, CDs, and IRA accounts�
Average Household Balance: Checking Accounts includes only Consumer Checking accounts
Comparisons are 2022 to 2023
Data: BAI Consumer Deposits Benchmarking
•
•
•
•
northeast
$30,843
-3.7%
yoy balance change

Banks in the Northeast have the third lowest balances in 2023, marking 6.8% under the national average of $33,021 and a decrease in growth rate by 3.7% compared to 2022.

deposit accounts

northeast
$13,217
-13.9%
yoy balance change
checking accounts
Northeast banks achieved the second highest checking account balances in 2023, exceeding the national average of $12,379 by 6.5% but witnessed a 13.9% drop in growth year-over-year.


northeast
34.5%
-0.4%
Comparison to�National Average
Checking�% of Total Deposits
Northeast banks ranked second lowest in 2023 for checking deposit balances, trailing the national average by 0.4%. Their checking share of total household deposit balances decreased by 3.6% compared to 2022.


south
38.1%
3.1%
Comparison to�National Average
Southern banks led in 2023 with the highest checking proporation of consumer household deposit balances, exceeding the national average by 3.1%. Despite this, their checking share declined by 7.4% from 2022.

south
$13,254
-16.0%
yoy balance change
Southern banks led with the highest checking balances in 2023, surpassing the national average of $12,379 by 6.8%, yet faced a decrease in growth rate of 16.0% compared to 2022.

south
$33,581
-3.3%
yoy balance change
Southern banks led with the highest average balances, surpassing the national average ($33,021) by 1.7%, though they faced a decline in growth by 3.3% from 2022 to 2023.
southeast
33.7%
-1.2%
Comparison to�National Average
Southeast banks lagged in 2023 with the lowest proportion of checking account balances, falling 1.2% below the national average. Their checking share dropped significantly by 8.2% from 2022.

southeast
$11,305
-16.6%
yoy balance change
In 2023, banks in the Southeast recorded the lowest checking account balances, 9.1% under the national average of $12,379, experiencing a significant decline of 16.6% from 2022.
southeast
$32,694
0.4%
yoy balance change
In the Southeast, banks posted the second highest average balances, just 1% shy of the national average of $33,021. They enjoyed a modest growth rate of 0.4%, making it the second highest and one of only two positive growth figures between 2022 and 2023.

upper midwest
36.8%
1.8%
Comparison to�National Average
Upper Midwest banks stood out in 2023 with the second highest proporation of checking balances, surpassing the national average by 1.8%. Despite this, their checking share of consumer household deposits declined by 3.9% from 2022.

upper midwest
$11,379
-14.2%
yoy balance change
Upper Midwest banks reported the second lowest checking balances in 2023, falling 8.4% short of the national benchmark ($12,379), with a 14.2% decrease from the previous year.

upper midwest
$29,309
-2.4%
yoy balance change
For 2023, banks in the Upper Midwest ranked second in having the lowest deposit balances, with figures 11.9% below the national average of $33,021, and experienced a drop in growth rate by 2.4% from 2022.
west
34.1%
-0.9%
Comparison to�National Average
Western banks ranked third lowest in 2023 for checking proportion of consumer household deposit balances, trailing the national average by 0.9%. Their checking share significantly dropped by 11% compared to 2022.

west
$12,344
-16.4%
yoy balance change
Western banks held the third highest checking balances in 2023, just 0.3% below the national average of $12,379, with a notable 16.4% decline in growth compared to 2022.
west
$28,230
-3.3%
yoy balance change
In 2023, Western banks in the U.S. recorded the lowest average household deposit balances, coming in at 15.6% less than the national figure of $33,021 and showing a decline of 3.3% from 2022.


Checking�% of Total Deposits
checking accounts
deposit accounts
Checking�% of Total Deposits
checking accounts
deposit accounts
Checking�% of Total Deposits
checking accounts
deposit accounts
Checking�% of Total Deposits
checking accounts
deposit accounts
get started
Interactive Map: Household Deposit Balance Accounts
Explore key data about average household deposit balances, broken down by region and categorized by bank size. Curious how certain areas or bank sizes stack up against the national average? We’ve got you covered. With a few clicks, you can uncover detailed insights about average checking balances and track year-on-year growth trends.
Click on a map region or a building to zoom into the specifics, revealing quick summaries that make comparisons seamless. It’s an easy, interactive way to view deposit trends at a glance.

view by�REGION
Deposit Accounts by Bank Size
Average Household Balance
about the data
Average Household Balance: Deposit Accounts includes all Consumer Checking, Savings, Money Market, CDs, and IRA accounts�
Average Household Balance: Checking Accounts includes only Consumer Checking accounts
Comparisons are 2022 to 2023
Data: BAI Consumer Deposits Benchmarking
•
•
•
•
about the data
$36,906
$30,181
$31,679
super regional
regional/community
large


super regional
32.7%
-2.2%
Comparison to�National Average
Super Regional banks recorded the lowest checking proporation of their consumer household deposit balances in 2023, lagging 2.2% behind the national average. Their checking share declined by 6.2% compared to 2022.
super regional
$10,622
-15.9%
yoy balance change
Super Regional banks recorded the lowest checking balances in 2023, 15.3% below the national average of $12,379, and experienced a significant 15.9% decline in growth rate from 2022.
super regional
$30,181
1.4%
yoy balance change
In 2023, Super Regional banks reported the lowest balances, 9.0% beneath the national average of $33,021, but achieved the highest growth rate of 1.4%, making it one of the two positive growth outcomes between 2022 and 2023.
Checking�% of Total Deposits
checking accounts
deposit accounts
REGIONAL/COMMUNITY
34.2%
-0.7%
Comparison to�National Average
Regional and Community banks ranked second in 2023 for their checking proportion of household deposit balances, yet trailed the national average by 0.7%. Their checking share dropped 6.6% compared to 2022.

REGIONAL/COMMUNITY
$13,818
-16.7%
yoy balance change
Regional and Community banks boasted the highest checking balances in 2023, 11% over the national average of $12,379, yet encountered the sharpest decline of 16.7% across all accounts compared to 2022.
REGIONAL/COMMUNITY
$36,906
-1.7%
yoy balance change
Regional and Community banks stood out with the highest average balances in 2023, 11.1% above the national average of $33,021, yet they experienced a negative growth rate of 1.7% compared to 2022.
Checking�% of Total Deposits
checking accounts
deposit accounts
large
38.7%
3.8%
Comparison to�National Average
In 2023, Large banks led with the highest proporation of checking deposit balances, outperforming the national average by 3.8%. Despite their lead, their checking share of total household deposits dropped by 3.7% from 2022.
large
$12,787
-14.7%
yoy balance change
Large banks in 2023 ranked second in checking balances nationwide, 3.2% above the average ($12,379), but saw a 14.7% reduction in growth compared to 2022.
large
$31,679
-5.9%
yoy balance change
Large banks registered the second lowest balances in 2023, falling 4.1% below the national average of $33,021, with a significant drop in growth rate by 5.9% from 2022.
Checking�% of Total Deposits
checking accounts
deposit accounts


Deposit Accounts by Region
Average Household Balance
view by�bank size
about the data
Average Household Balance: Deposit Accounts includes all Consumer Checking, Savings, Money Market, CDs, and IRA accounts�
Average Household Balance: Checking Accounts includes only Consumer Checking accounts
Comparisons are 2022 to 2023
Data: BAI Consumer Deposits Benchmarking
•
•
•
•
about the data
deposit accounts